Analyzing Road Collision Data (2019-2022)
Understanding Accident Severity for Effective Road Management
Link to project repository on GitHub
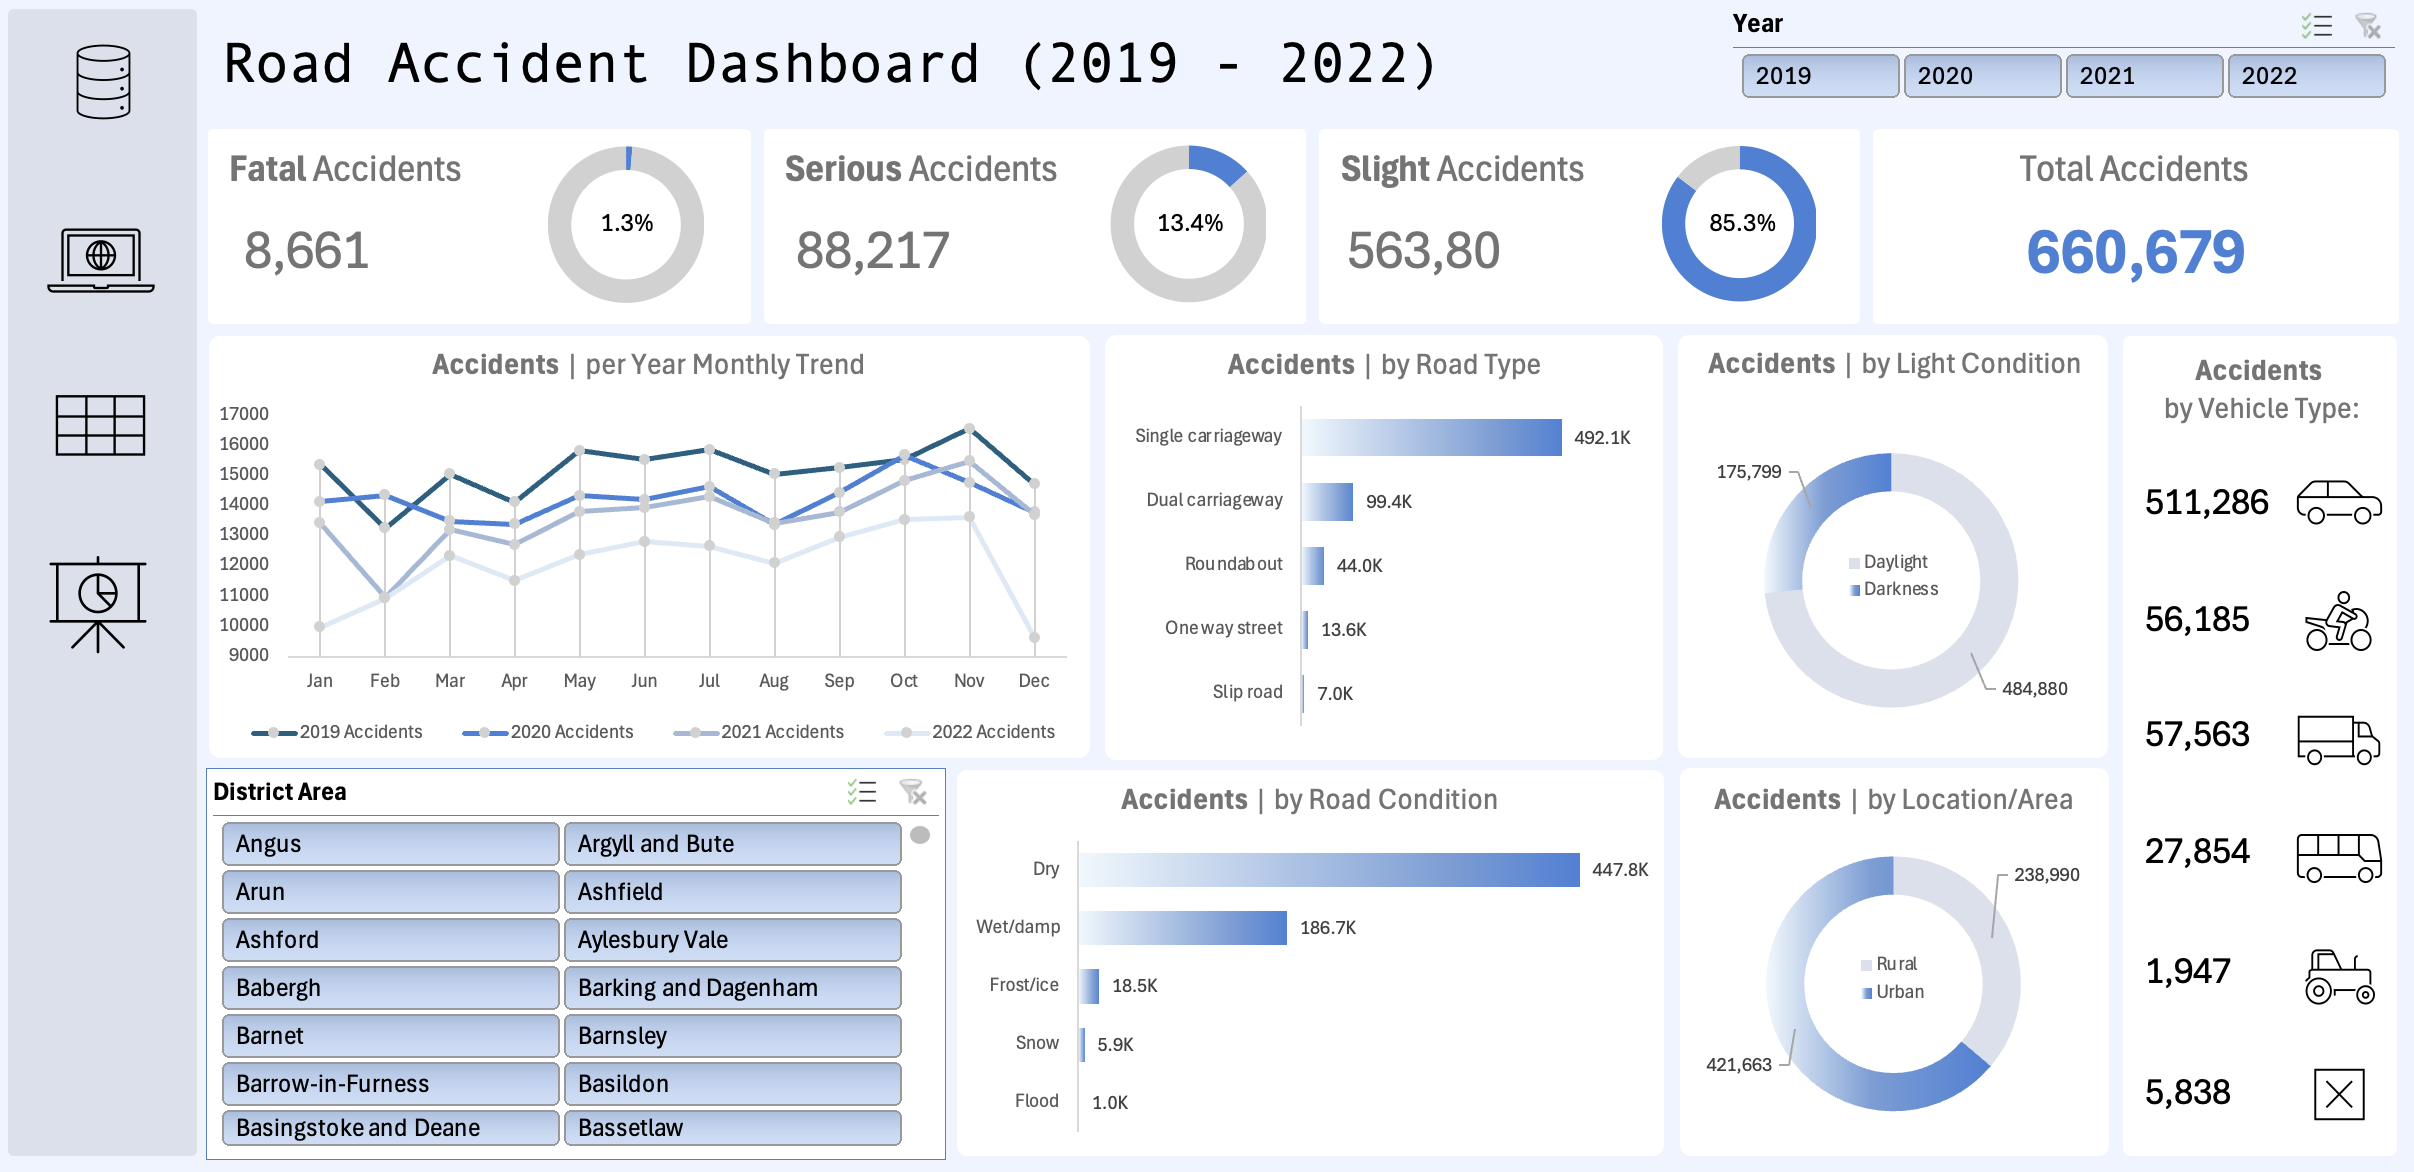
Goal: Gain insights into the patterns and trends of road accidents in the UK from 2019 to 2022 to inform policy-making and improve road safety.
Metrics and Dimensions
- Total: number of accidents
- Accident Severity: Accidents and percentage of total with respect to accident severity
- Vehicle: Total accidents by type of vehicle
- Accidents per Year: Monthly trend showing a comparison of accidents for the current year and the previous year
- Road Type: accidents by road type
- Light Condition: accidents by day/night
- Road Condition: Distribution of total casualties by road condition
- Location/Area: The type of area where the collision takes place
- Relationship between accidents by area/location and by day/night
 If you wish to take a closer look at the excel file and use the dashboard, you can download the .xlsx file here.
Summary of Findings
Accident Severity
- The majority of accidents are slight, accounting for 85.3% of the total.
- Fatal accidents constitute only 1.3% of the total.
- Serious accidents make up 13.4% of the total.
Vehicle
- Regular cars are most frequently involved in accidents, followed by motorcycles.
Accidents per Year
- Accident rates are consistently high from May to July across all four years.
- Most years see a peak in accidents in November.
- February typically has the lowest number of accidents each year.
Road Type
- Single-carriageway roads witness the highest number of collisions (492.1K).
- The least amount of collisions occur on a slip road.
Light Condition
- The majority of collisions occur during daytime (approximately 75%).
Road Condition
- Most collisions occur on dry roads (447.8K).
- Collisions on flooded roads are rare (1.0K), likely due to the infrequency of floods.
Location/Area
- The majority of collisions occur in rural areas, likely due to the higher population density in these areas.
Recommended Next Steps
- Collaborate with stakeholders (Department for Transport, Road Safety Corps, Traffic Management agencies, etc.)
- Engage with local authorities, transport agencies, and road safety organizations to share insights and collaborate on safety initiatives.
- Use the findings to support grant applications and funding requests for road safety projects.
Database Information
Database: https://www.kaggle.com/datasets/nezukokamaado/road-accident-casualties-dataset
Each row represents an instance of a car crash with the following information:
- Index: The refrence code (index) of the collision
- Accident_Severity: The severity of the collision (Fatal, Serious, Slight)
- Accident Date: The date of the collision
- Latitude: The latitude coordinate of the collision
- Light_Conditions: The light conditions during the collion (ex. day, night, streetlamps on, streetlamps off)
- District Area: The district where the collision took place
- Longitude: The longitude coordinate of the collision
- Number_of_Casualties: The number of casualties caused by the collision
- Number_of_Vehicles: The number of vehicles involved in th ecollision
- Road_Surface_Conditions: The road conditions (wet, frost, dry, etc.)
- Road_Type: Type of road (ex. Single carriageway, Dual carriageway)
- Urban_or_Rural_Area: Area type
- Weather_Conditions: Weather conditions during collision
- Vehicle_Type: Type of vehicle inolved in collision