
Scooby Doo TV Ratings Analysis
Unmasking Episode Popularity
Link to project repository on GitHub
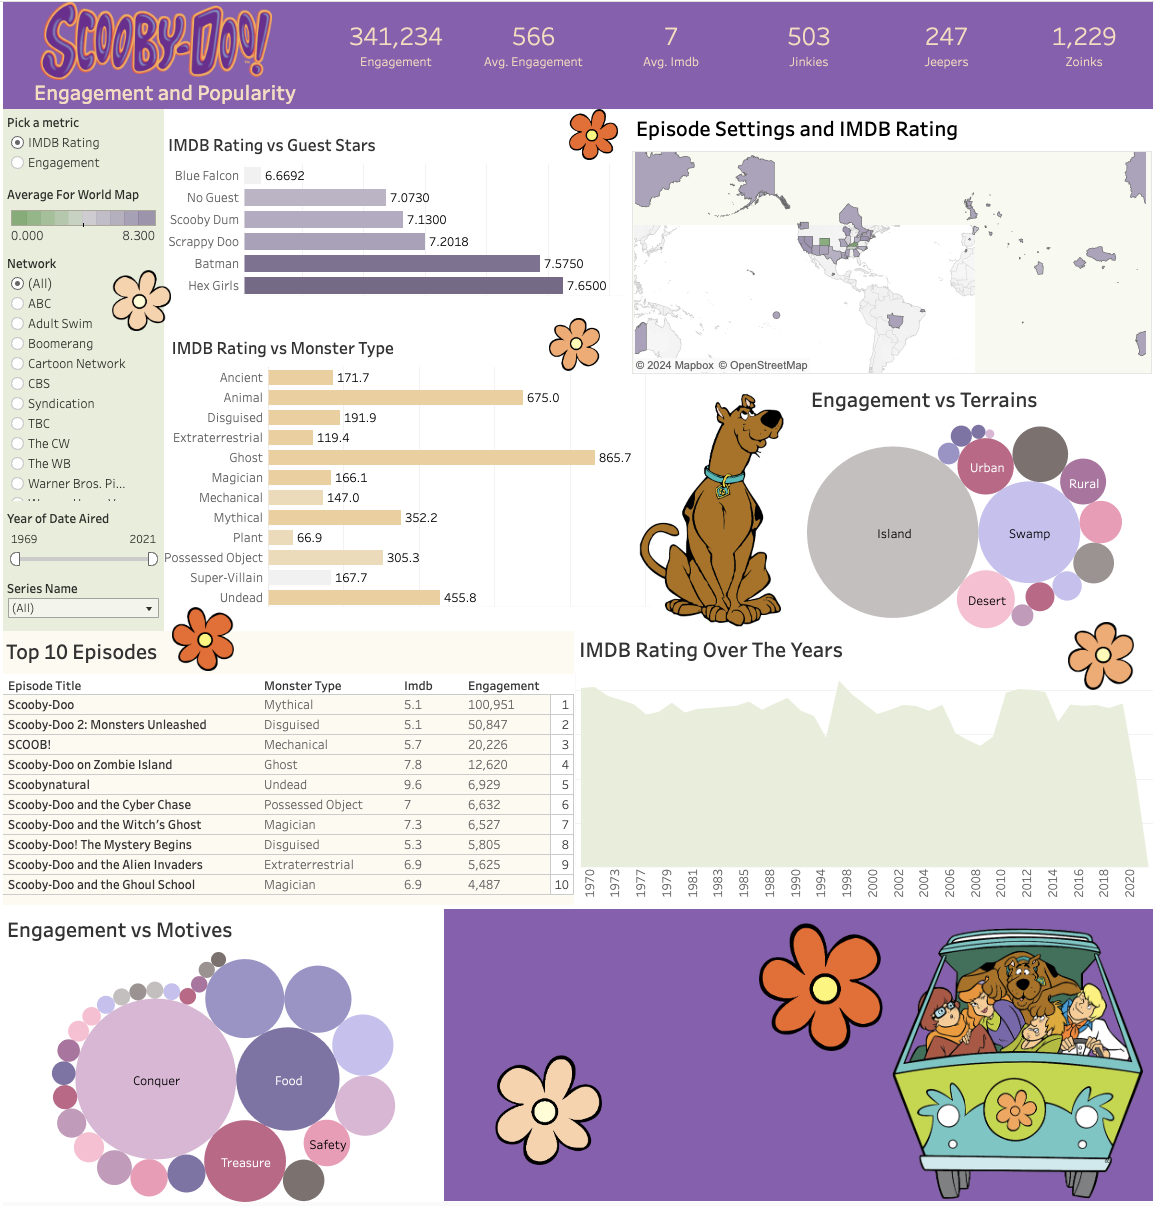
Thanks to a CD I got from a cereal box, I watched the TV show "Scooby Doo Where Are You?" on repeat for years. And it is still one of my comfort shows to this day. I was excited to combine nostalgia with my love of data analysis for this project. I have created a dynamic dashboard that allows users to analyze episode popularity and IMDB scores. Users can explore insights into different networks, series titles, monsters, settings, time frames, and guest stars using filters.
This project has two parts:
- Part 1: General Data Cleaning in SQL
- Part 2: Interactive Dashboard
- Which guest stars do the audience enjoy seeing the most?
- What episode settings do the audience enjoy the most? (Are certain locations and terrains exciting to viewers?)
- What kind of monsters does the audience love to see?
- Which networks were the most popular?
- What was the most popular Scooby Doo show?
- What were each of the networks most popular monsters?
- What are the most popular Scooby Doo episodes ever? Or for each specific network?
Below is a screenshot of my Tableau Dashboard
Database Information
Database: https://data.world/amberthomas/scooby-doo-tv-episodes-movies
Each row represents an episode of the TV show Scooby Doo. There were over 70 columns so I decided on only keep the columns I would be directly using for this project (I also added a few of my own). The columns that I will be working with are:
- index: The index for the database
- series_name: The name of the series the episode or movie is from
- network: The network the episode or movie aired on
- season: The season of the series the episode or movie is from
- title: The title of the episode or movie
- imdb: The IMDB rating of the episode or movie
- engagement: The engagement rating of the episode or movie
- date_aired: The date the episode or movie aired
- format: The format of the episode or movie
- monster_name: The name of the monster in the episode or movie
- monster_type: The type of monster in the episode or movie
- setting_terrain: The setting of the episode
- setting_country_state: Where the episode took place
- motive: The motive of the culprit in the episode or movie
- jeepers: The number of times "Jeepers" is said in the episode or movie
- jinkies: The number of times "Jinkies" is said in the episode or movie
- my_glasses: The number of times "My Glasses" is said in the episode or movie
- zoinks: The number of times "Zoinks" is said in the episode or movie
- groovy: The number of times "Groovy" is said in the episode or movie
- caught_by: The people who caught the monster
- captured: The people who were captured by the monster
- unmasked: The people who unmasked the monster
- guest_stars: The guest stars of the episode